Proof that Volatility is Opportunity
An app that replays the markets from 2010-2023
*This post is best viewed on a PC or tablet*
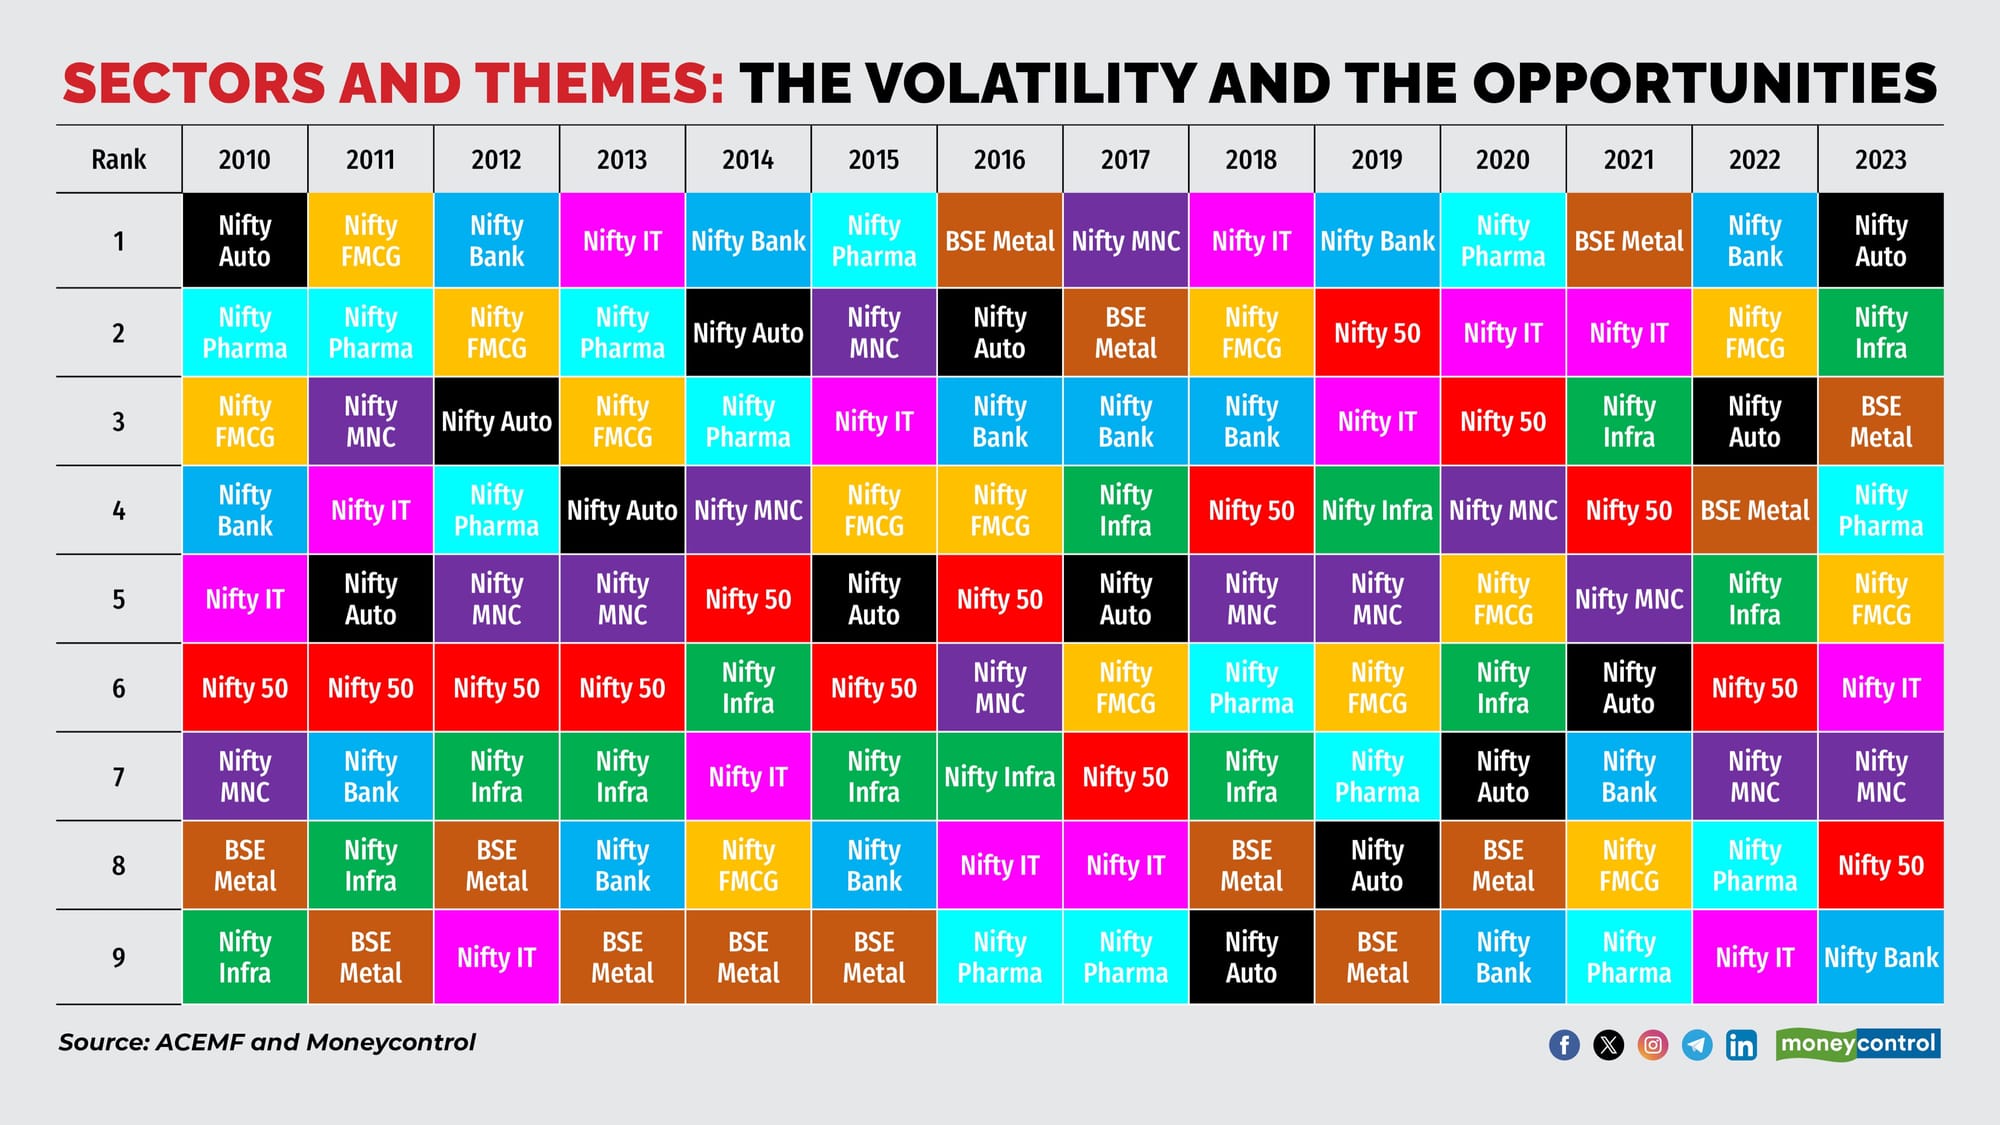
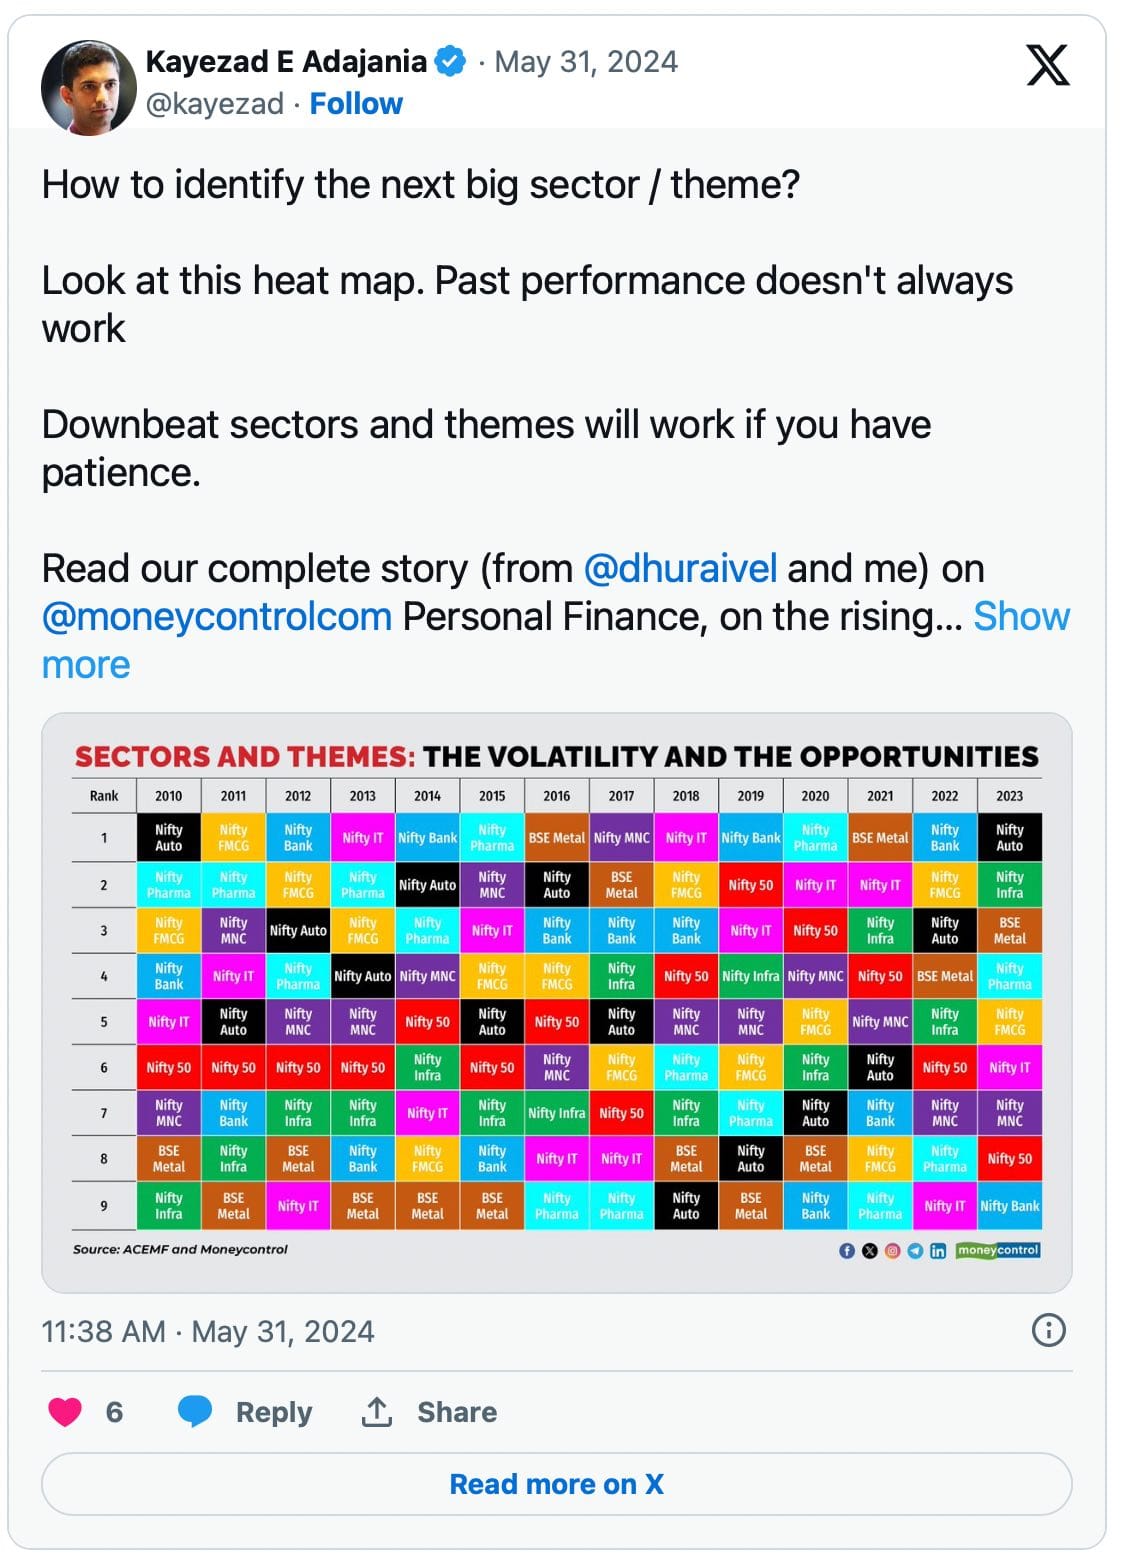
We have previously discussed that volatility is a feature of financial markets, and not a bug. I recently came across this insightful graphic that illustrates the annual rankings of various sectors based on their returns and how these rankings fluctuate over time.

This heatmap clearly shows that sectors that underperform eventually rebound, while those that outperform eventually experience a downturn.
I wondered if this information would be more compelling for investors if we could replay how a sector’s return rankings evolved over the years. Try out the app below.
APP
Replay the Past
Trace the movement of sectors from 2010-2023
Observations
- If this is not a conclusive illustration of value investing, I don't know what is. It clearly pays to focus on the overlooked areas that the market has abandoned. While the popular sectors grab attention, the good opportunities may lie in the neglected corners, with a very high margin of safety.
- Note how the Nifty-50 (which is the only non-sectoral index in the list) generally ranks at the middle. A solid case for blindly investing in the index itself!
- 👀 IT & Banking!
Learning to live with volatility (and profit from it)
Volatility is an opportunity for long-term investors. And they must be prepared to take advantage of it.

Related post


Member discussion