Decoding Market Fluctuations

(This is the first post in a series reconciling stock price fluctuations)
The stock market alternates between peace and turbulence, with stocks biased to rise or fall. During a bull run, the market keeps making new highs before reaching a peak. Then, some adverse event happens, leading the market to fall and prices continue to decrease. After a while the decline stops and the trend reverses upward.
This pattern of alternating highs and lows reminds me of high school calculus and the concept of Maxima and Minima. The Maxima is the maximum value at a given interval and the Minima is the minimum value in that interval.
Look at the curve below. It has multiple Maximas and Minimas in each interval.
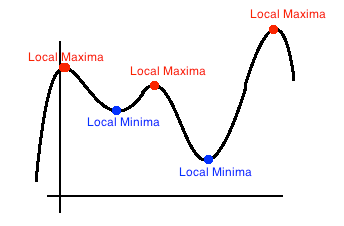
What is interesting is that a curve will have only one absolute Maximum and Minimum value, but it can have many maximas and minimas.
Returning to markets, as the stock price fluctuates, the resulting curve meanders and slopes, forming peaks and valleys – the maximas and minimas.
The figure below depicts the episode of the Great Financial Crisis.
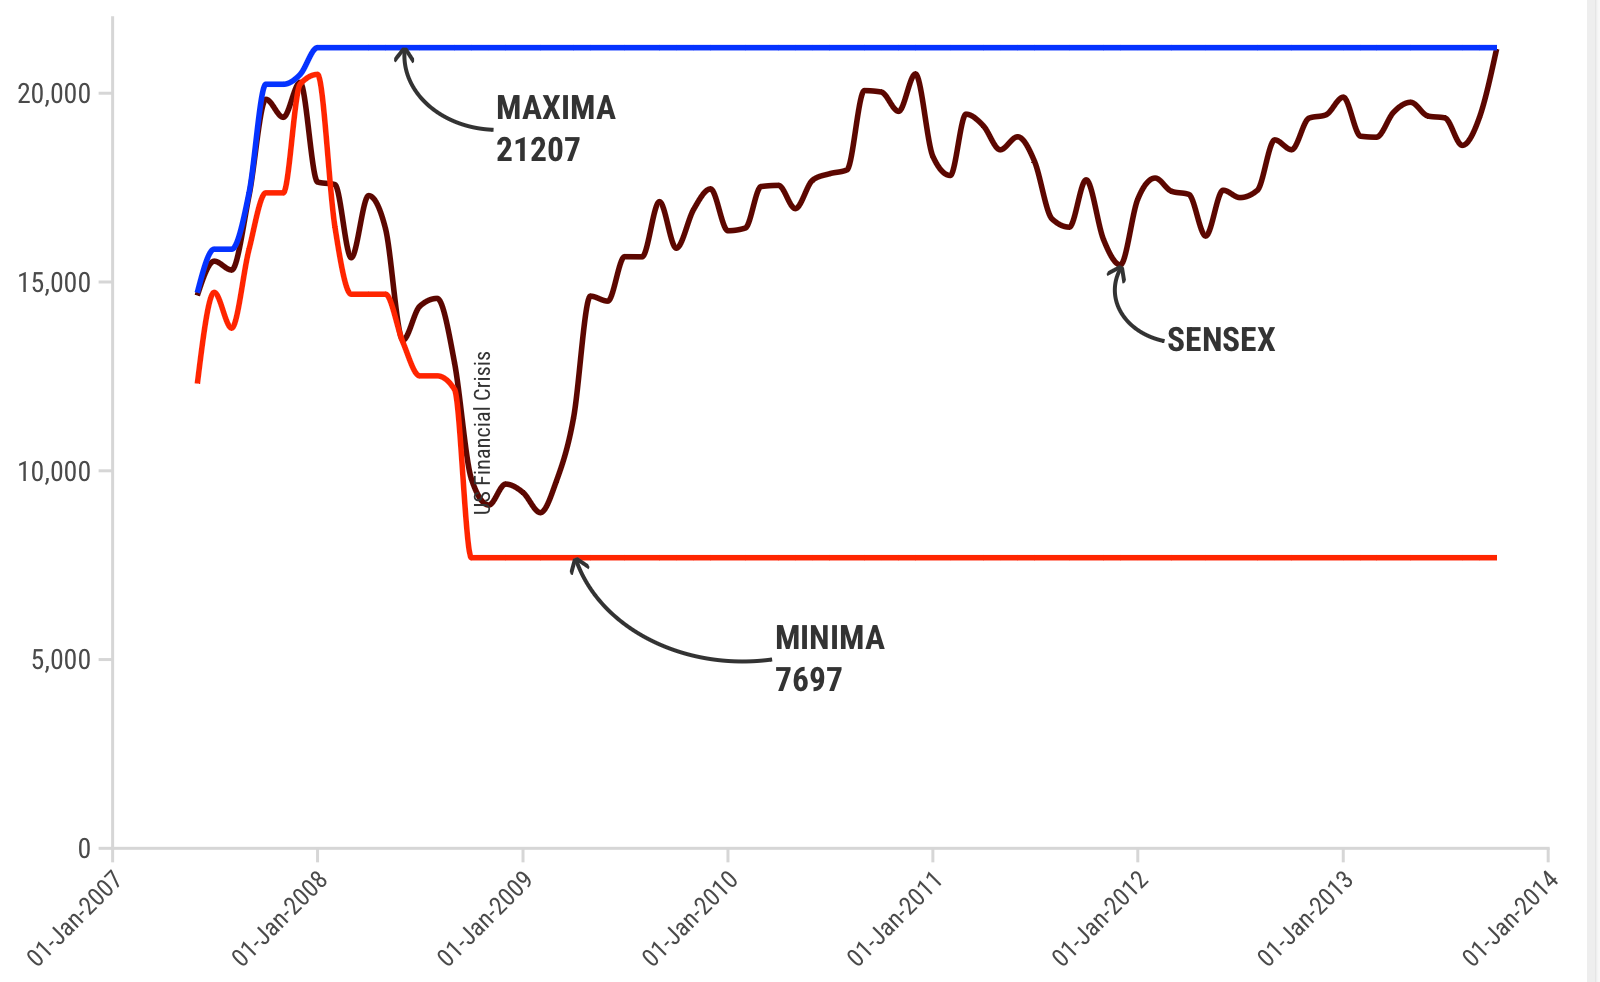
Before the crisis, the Sensex had peaked in early 2008. The fall lasted 14 months. Looking back we observe that the market fell from a Maxima of 21000 and achieved a Minima of 7000 (a 63% drop – the largest fall in the Indian markets).
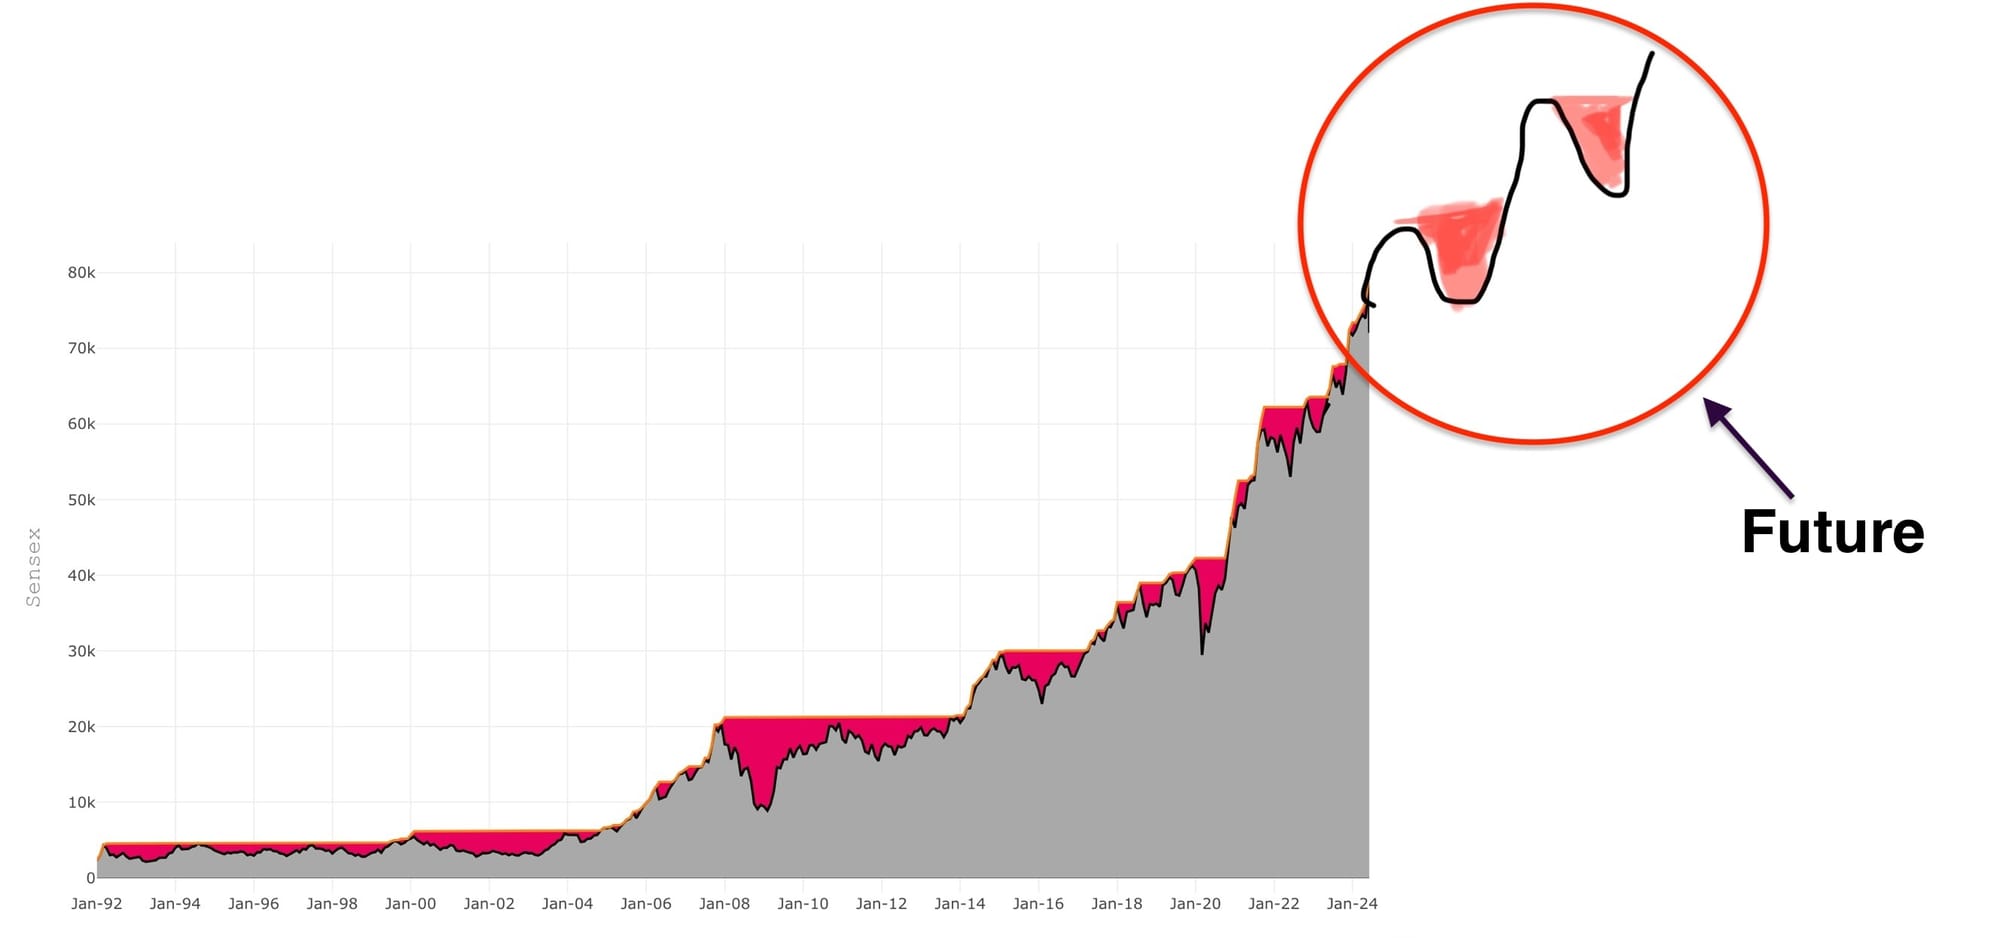
Viewing stock prices as a series of episodes with their own high and low points is very useful. It becomes evident that a significant increase in stock prices (like the current markets) will be followed by a decline. At the same time, the current market high will be followed by an even higher peak in the future, but not before a trough in between.
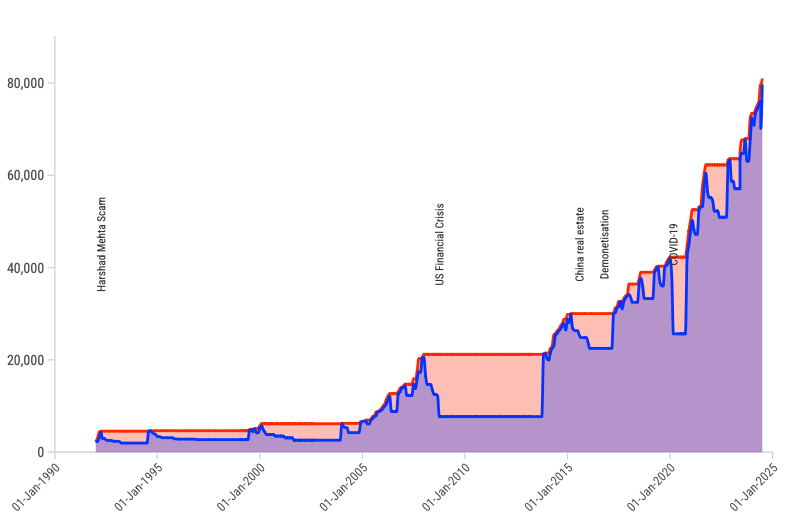
Let’s see how the Indian markets moved in terms of their Maxima and Minima over the last many years, starting with the Sensex Maxima.
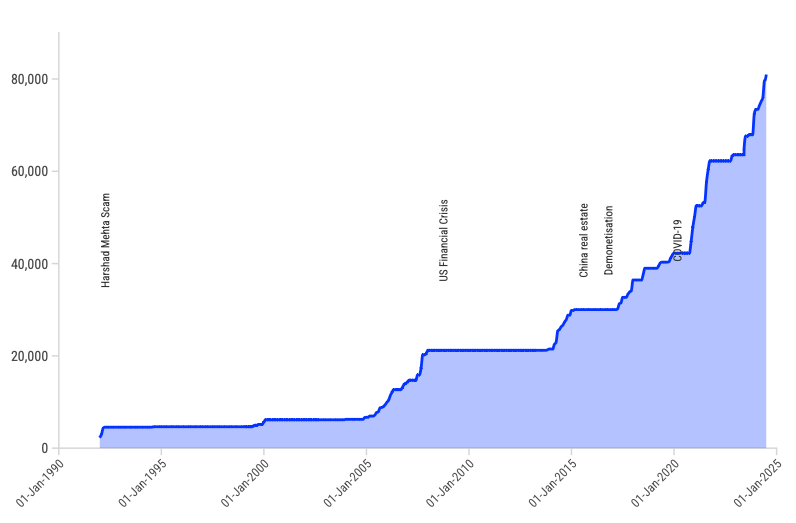
This is a benign step curve that’s flat for long times before sloping upwards in the long-term. Any point on the curve represents the then maximum value of investor portfolios. This curve conceals the volatility and drama that the markets have endured. For that, let us plot the Minima.
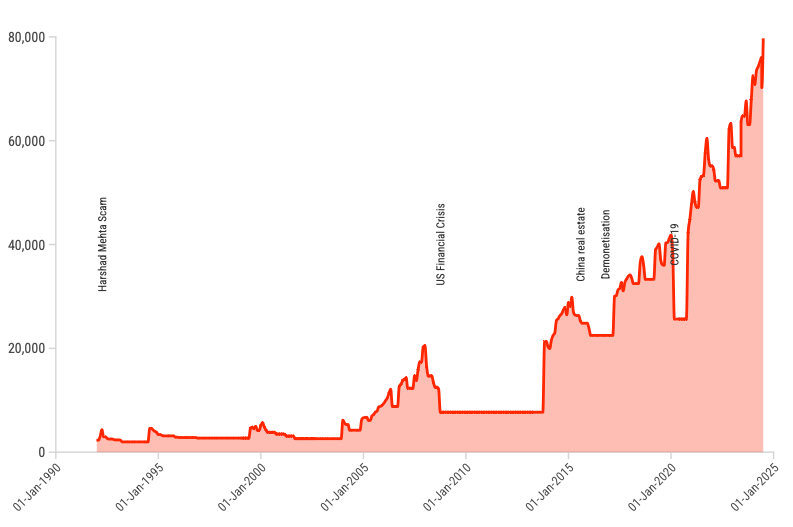
This chart represents the market floor at any time. At all points on this curve, the investor portfolios were at their then maximum loss.
Combining the Minima and Maxima reveals the long-term market story. The red buckets represent losses faced by investors from the previous peaks (also called drawdowns or drawdown losses).
In 2008, markets fell by 60%, leaving investors unable to predict the future and feeling the impact of losing half their wealth. However, in hindsight, we know that the market eventually went on to surpass even the pre-crisis peak.
The below chart plots the Sensex over the past 30 years, including its maxima, minima, and the major crises.
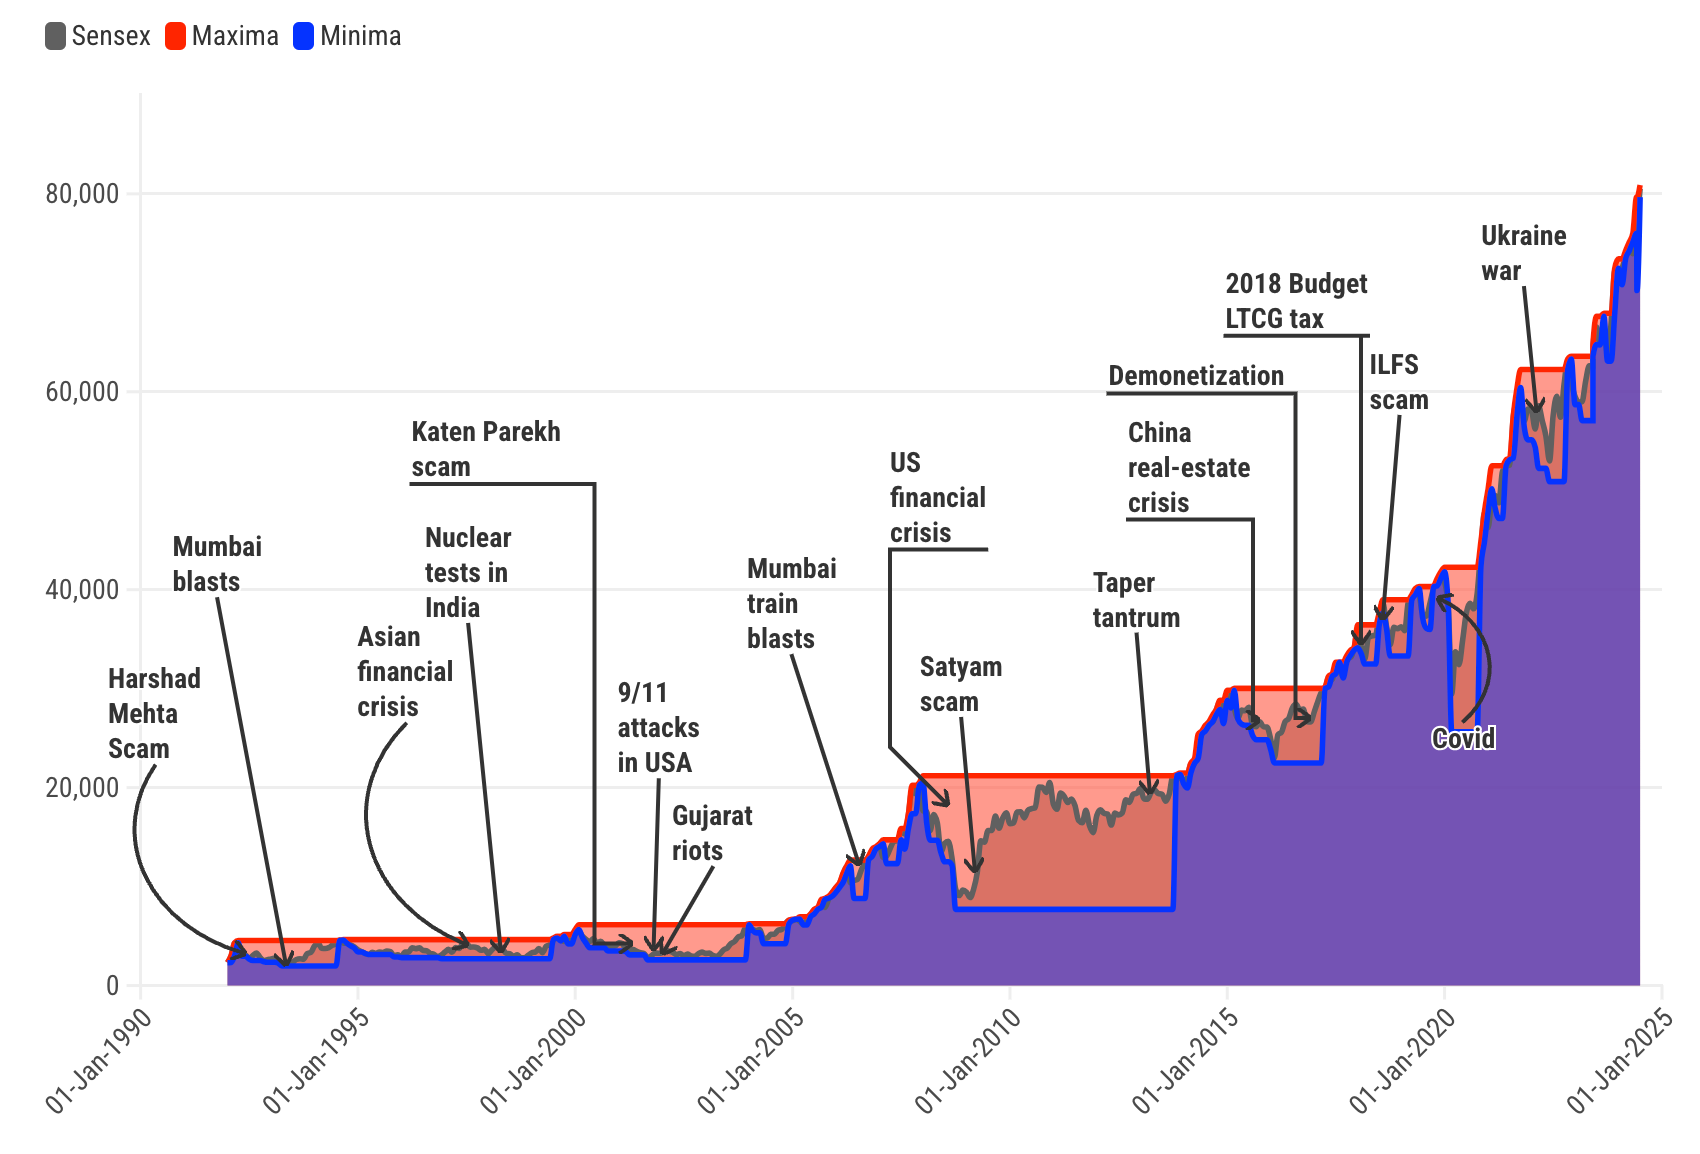
It is clear that the markets go up in the long term, but not constantly. The long-term upwards movement is the sum of many many episodes, each with its own local maxima and minima and accompanying drama.
In summary, as markets rise, they reach a peak, the local Maxima, before prices fall. The market then meanders down to reach its lowest point, the local Minima, before rising again to surpass the previous Maxima.
The psychological impact on investors
Ups and downs severely affect human psychology. The suspense of real-time price fluctuations weighs on investors. There is no way that they can know if markets are near the peak (in bull markets) or the bottom (in bear markets), since the Maxima and Minima can only be known in retrospect, not in real-time.
Let's consider the markets' fresh upwards move after a bear episode. Investors don’t know in real-time how far the market will rise, or if it's a false start and prices will crash again. Affected by the previous downturn, many will naturally sell their holdings at the first sign of appreciation.
Even experienced investors can be baffled by the continuous price increases in a bull market (like the current one).
As the market keeps rising, every small fall presents a dilemma: is it a normal pullback, or the first step of a prolonged downturn? If there were a bell to announce the peak, everyone could sell and avoid significant corrections. But since the future is unknown, investors are forced to deal with the uncertainty and discomfort as they hold on to their stocks.
Being an investor isn’t easy: if you sell and the markets go up, it leads to resentment. If you hold and they crash, you regret not selling at higher prices.
The markets will eventually fall in response to an adverse event. As the decline happens, it’s again unclear where the lowest point lies. For investors holding stocks, the losses accumulate. 20-30% wealth erosion is normal. But these losses seem greater due to loss aversion bias (loss feels ~3x worse than a similar gain).
As investors endure price drops for months, their survival instinct activates, tempting many to sell and cut their losses. This holds true for even the most experienced investors, since the market's potential decline remains uncertain.
Accepting the inevitability of market fluctuations
Viewing stock prices through the lens of Maxima & Minima has many advantages. Doing so, we explicitly acknowledge that the current drama is representative of the current interval. In the short and medium-term, the market will fluctuate, but the long-term trajectory will generally be upwards.
Also, it is clear that one cannot jump to a future Maxima bypassing the interim Minimas. This mental model promotes the long-term mindset and discipline required to remain invested and grow wealth over time.
Go to part2: Drawdowns & Corrections
Member discussion