Visualizations

Charts and visualizations that were originally created for various posts, but stand alone as unique stories.

This page is best viewed on a PC or tablet rather than a phone.

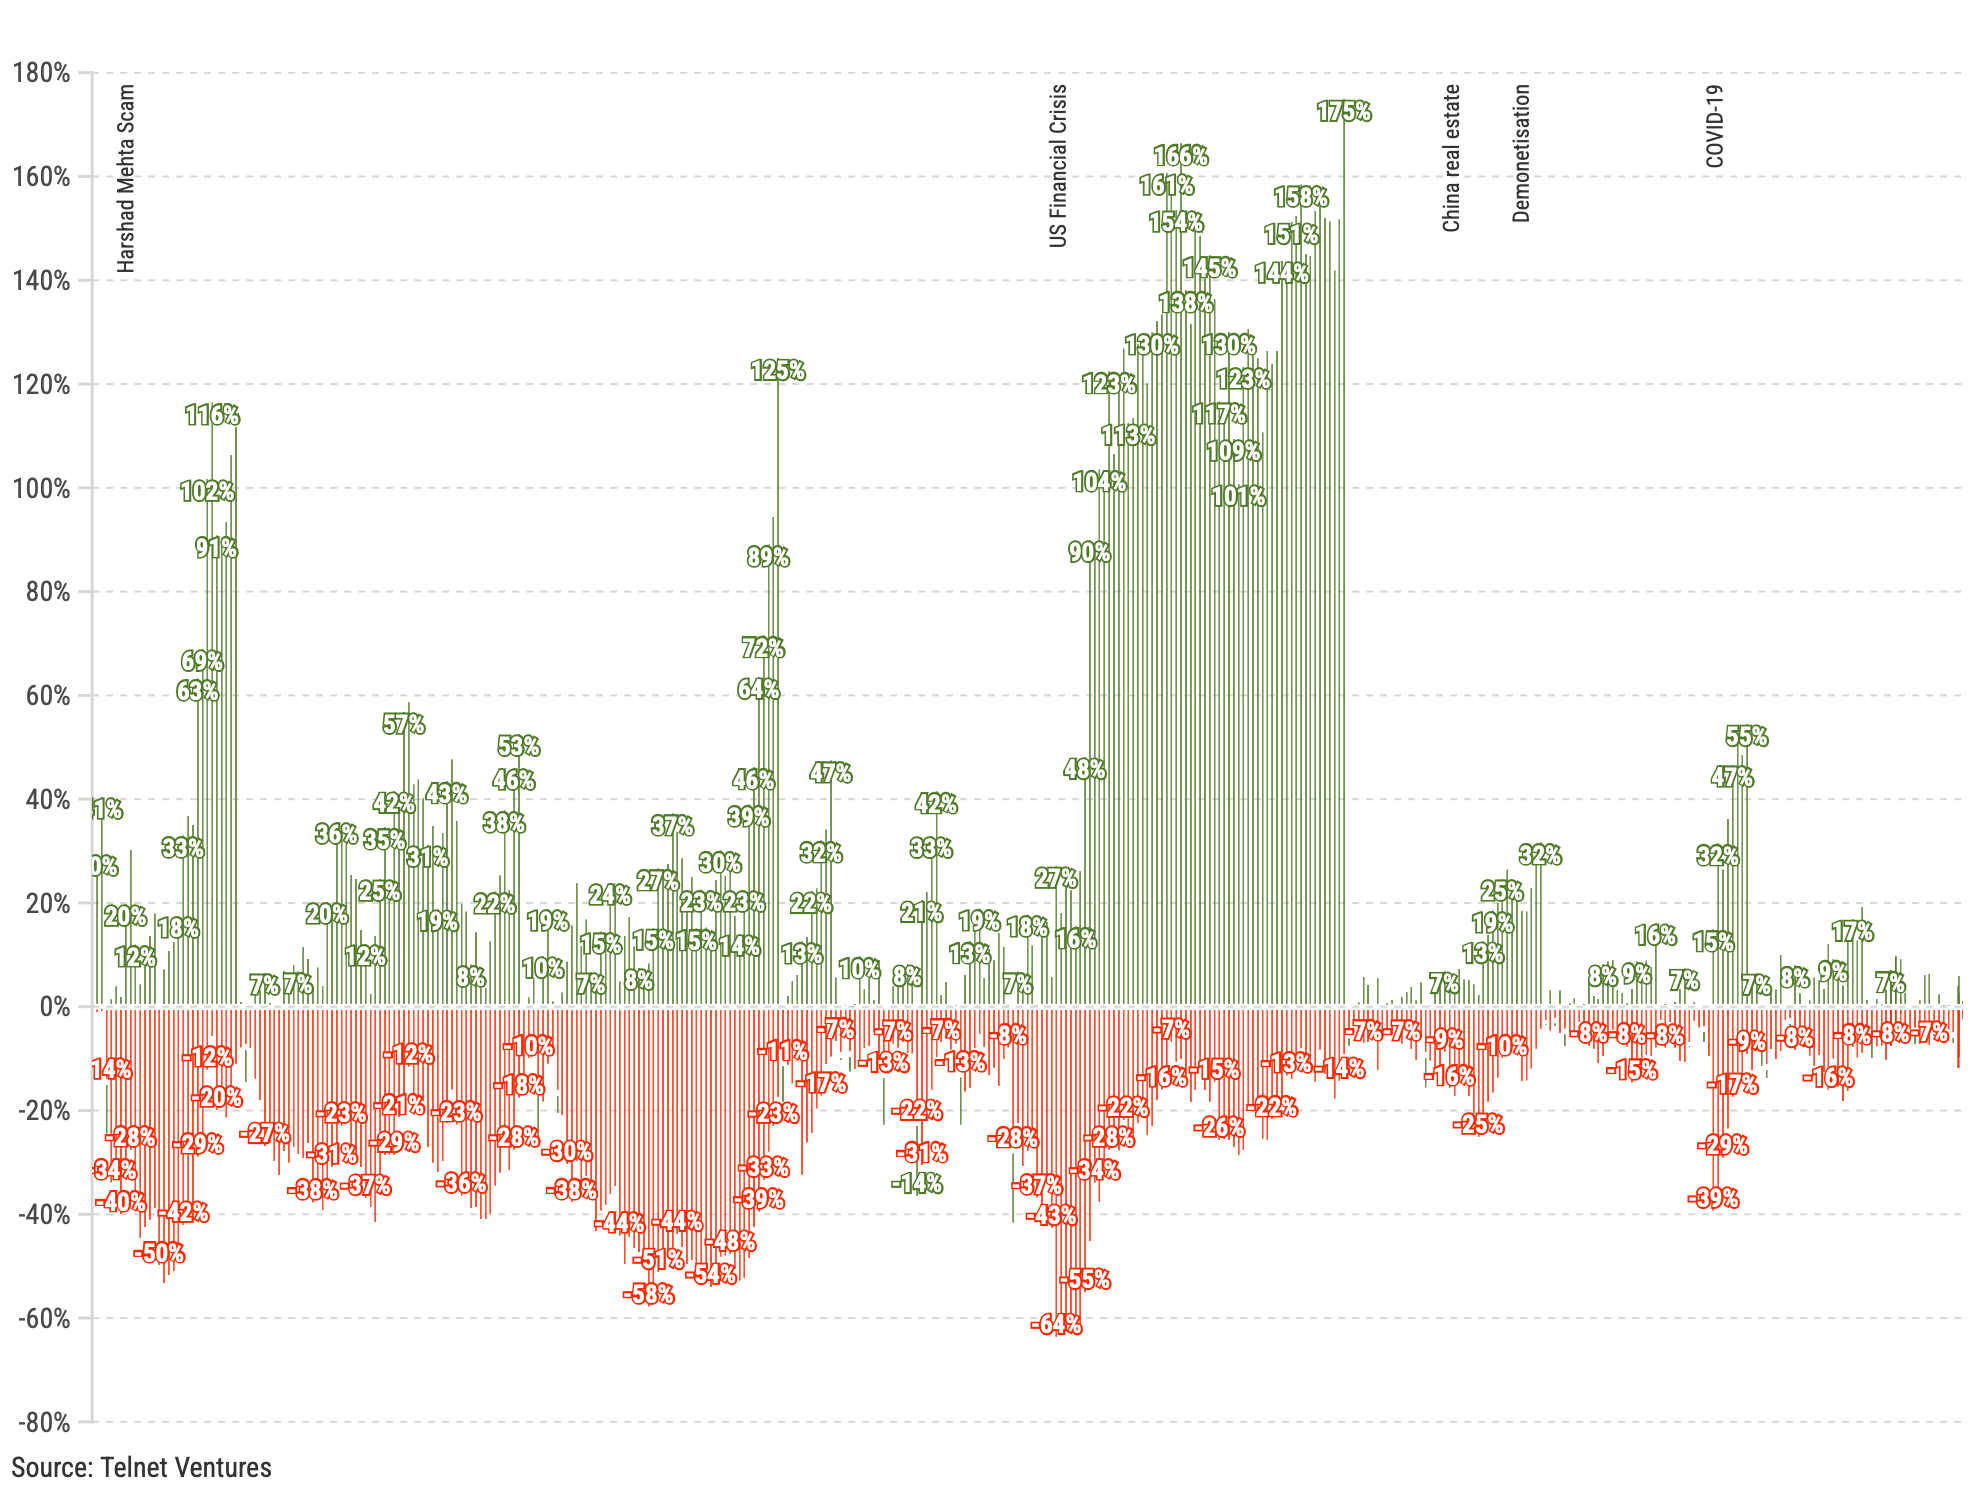
Biggest Falls in the Indian Market

Referenced in “Anatomy of a Crash: the Market Meltdown of March 2020”

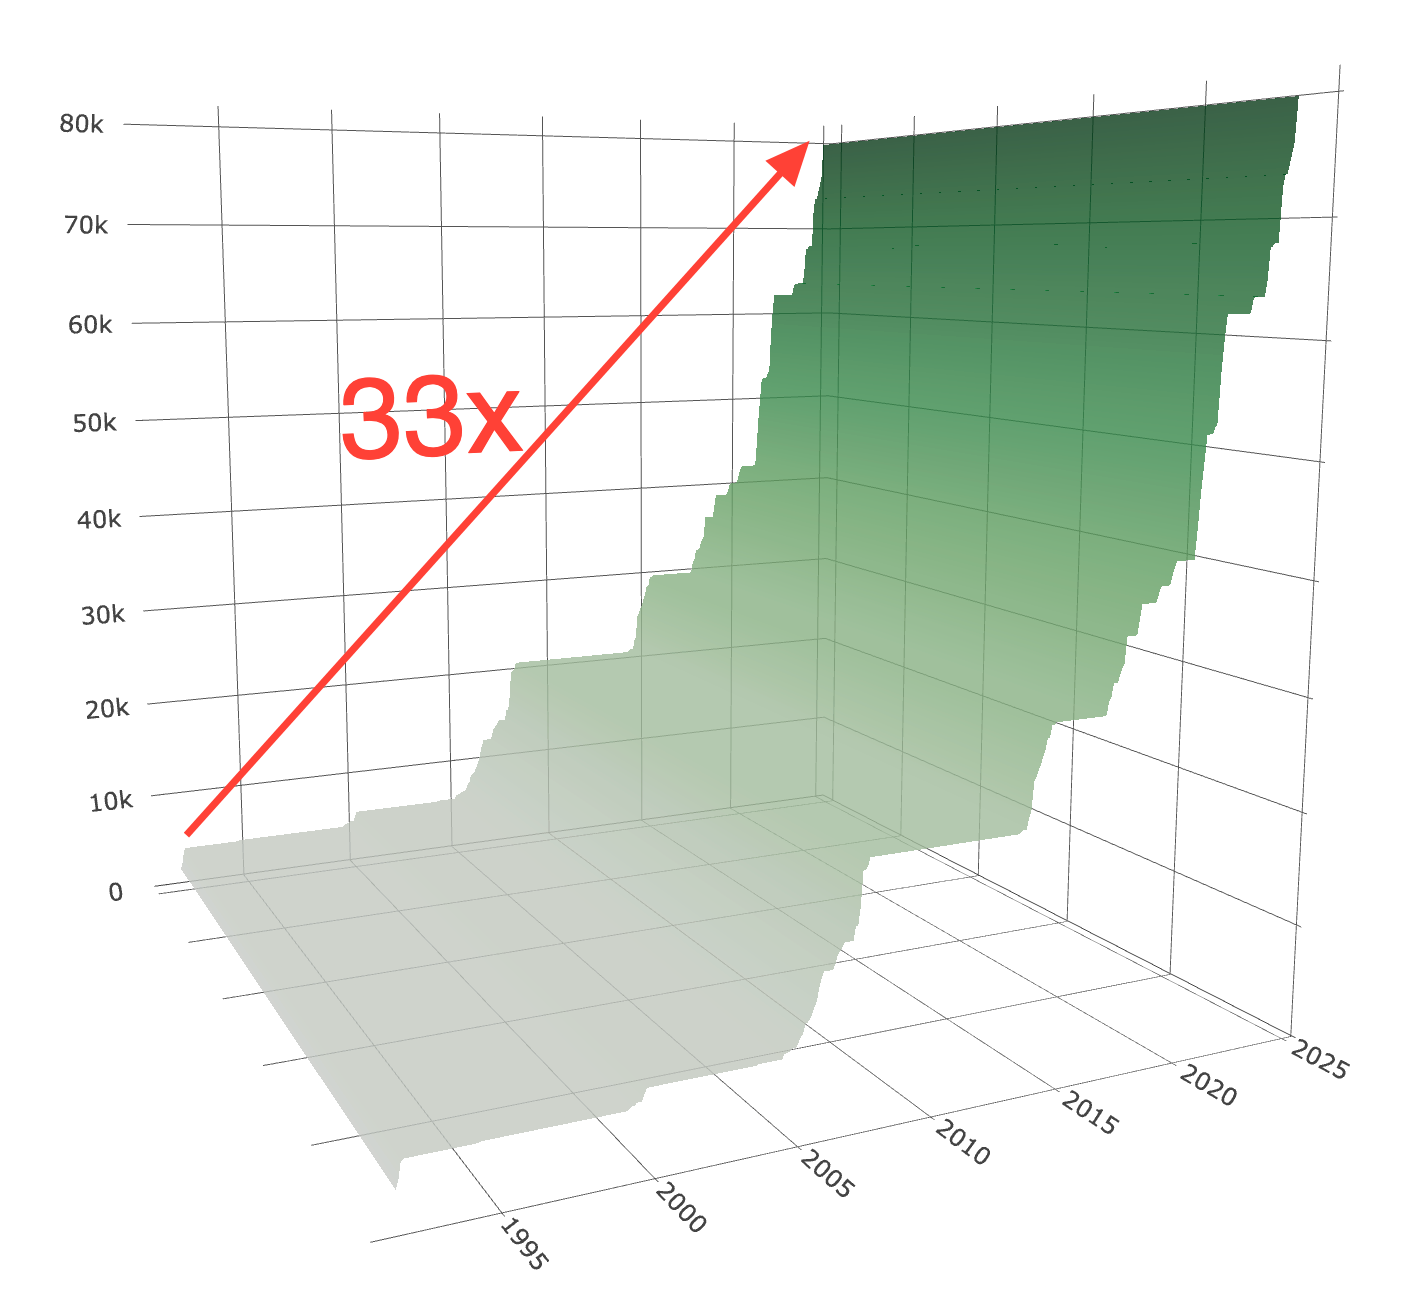
A History of Crises

Crisis after crisis the markets have moved up defiantly

Referenced in “Learning to live with volatility (and profit from it)”

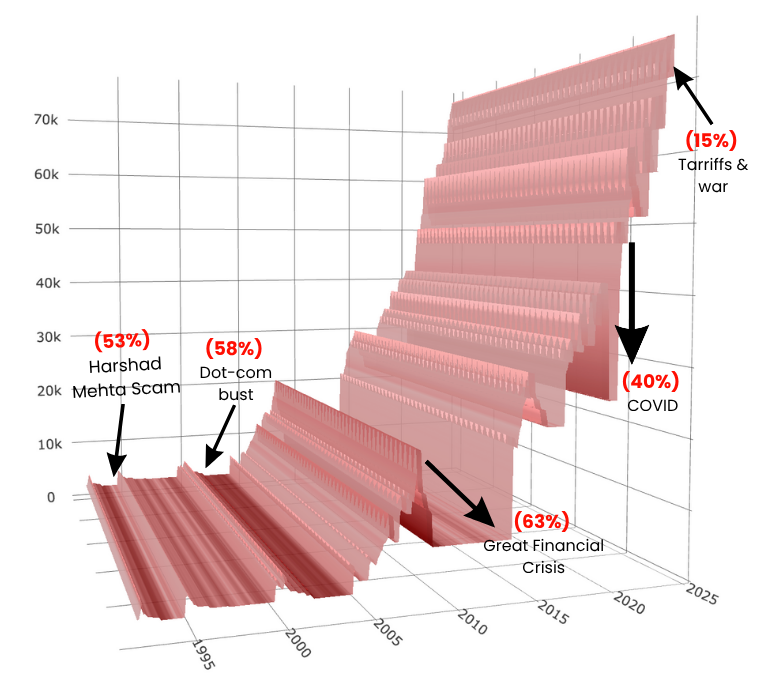
Relive the Drawdowns

Investors have lost >50% of their wealth multiple times

Created for "Drawdowns & Corrections"

Click to play

Returns This Year and Next

Low returns in one year often result in higher returns the following year, and vice versa.

Referenced in “Learning to live with volatility (and profit from it)”

APP

Performance of Sectors

Explore the returns of various sectors from 2010 to 2023. What goes up must come down.

Referenced in “Proof that Volatility is Opportunity”